Daily Operations
Automated Strategy Operations ES Futures — 12 March to 3 April 2026
The charts you see in this entry, Automated Strategy ES Futures… are not from a demo or an isolated backtest. They are the real result of an automated strategy operating on ES (S&P 500 Futures) over the past few weeks, since the first day we decided to make it public.
What makes this strategy different?
The core of everything is the dynamic timeframe. It's not a complicated concept to understand, but it is very difficult to develop correctly. Most strategies use a fixed timeframe — 5 minutes, 15 minutes, 1 hour — regardless of how the market is behaving that day. That's like always using the same magnifying glass no matter what you're looking at.
Our timeframe is recalculate uniquely for each market session, adapting to their actual range and behaviour. The result is immediate: the chart «cleans up» from noise, and entries that previously seemed valid but were compromised by their own candle range simply disappear from the radar.
We have been developing and refining this logic for over two years. It didn't come about overnight. It went through extensive backtesting, then a simulated environment, and now it's operating live. Each phase has confirmed the same thing: dynamic timeframe isn't just another filter, it's the foundation upon which everything else is built.
What the graphs show
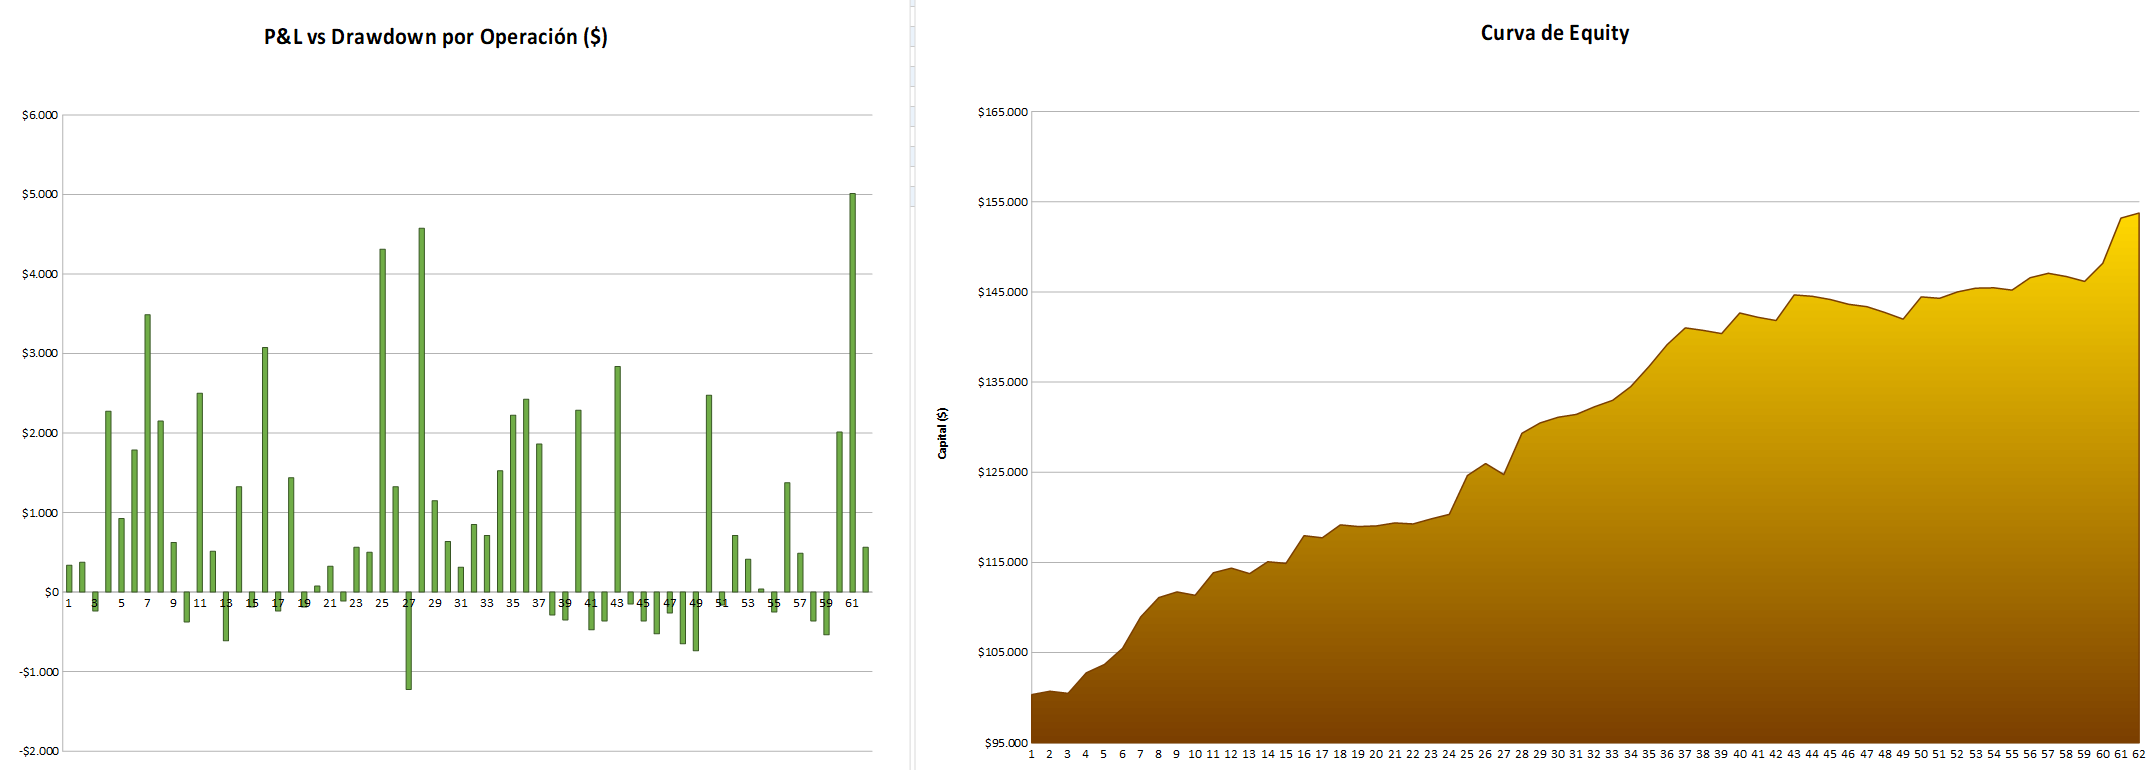
The first graph shows the P&L per operation — each bar is a trade. Profits, losses. What stands out most isn't the height of the winning trades, but the containment of the losing trades. The drawdown per trade is consistently controlled. That's not luck — it's structure.
The second graph is the cumulative equity curve. Part of 100,000$ and reflects each operation sequentially. It’s not a perfect line – no real strategy is – but the direction is clear. The progression speaks for itself.
Both come from a 100% automated environment. No manual intervention, no emotional bias, no cherry-picking of operations.
Does it only work in Spanish?
No. The same logic applies to FDAX, NQ and other futures. The dynamic timeframe adapts to the instrument and the session, which is why it is not tied to a single market. It is methodology, not a specific pattern for a particular asset.
An important note
This is not a promise of future profitability. Markets change, and no system is infallible. What we can say is that this strategy has years of real work behind it, not a quick sale idea. If you are interested in understanding the approach beyond the numbers, you are in the right place.
We will continue to update this section weekly with the actual results.